Top 5 Tasks Chartio Does For Me
You know how sometimes you find a product that makes your work so much easier you wonder how you ever worked without it? Here at Filestack we hope our customers feel that way about us, but while focusing on making Filestack better, we’ve found a few products indispensable.
Hi, I’m Caitlin, I work on data analytics at Filestack, and I’m kind of obsessed with Chartio.
Chartio is a data visualization software that I use to build charts and graphs for reports. Why is it so great? Chartio is pretty powerful, but honestly, the best thing about it is the time it has given me back. I used to spend about 30% of my week on superficial tasks. Now, thanks to Chartio, I get to spend that time doing more of what I love: deeper analysis of Filestack’s more complex questions. How did Chartio give me back all that time? Below are the top 5 tasks I no longer have to do now that I have Chartio.
1) No more -daily, weekly, monthly- continual updates of the same old charts with the latest data.
We are constantly looking at our data. Without access to real-time information, we run the risk of making big decisions on stale data. Although some of the existing tools I use graph our recent data, most of the data I use is stored in Google’s Big Query. Big Query is a SQL-like database that I can query and export directly to Google Sheets from, but I still have to run those queries and build the graphs in Sheets manually anytime I want an update.
Putting aside my extreme dislike for Google Sheets graphs (which are serviceable, mostly), before I had Chartio, I was spending about a third of my time updating existing graphs with new data. Do you know what is most exciting about my job? Finding new ways to explore our data and uncovering the answers to new questions with what I have available to me. Do you know the most boring thing about my job? Repetitive updates to existing charts that are more button pushing and saved queries than brain teasing puzzle.
Chartio lets me spend my time building charts rather than updating them. Once I build something in Chartio, I can tell it to update automatically every day, every hour, or manually every time I click “Refresh Data”. Sure, occasionally something breaks a chart and I have to make minor fixes, but even that is interesting.
Bonus: Chartio has a “snapshot” feature that takes a picture of the dashboards each day so when I’m trying to remember what a chart looked like a day, week, month ago, I can actually go back and look.
2) No more building a separate chart for every possible view people might want to look at.
You know how sometimes you’re in the middle of a meeting and your boss wants to see that data by week instead of month? Or by day? Or maybe they wonder what it would look like if you just tweaked the dates you’re looking at.
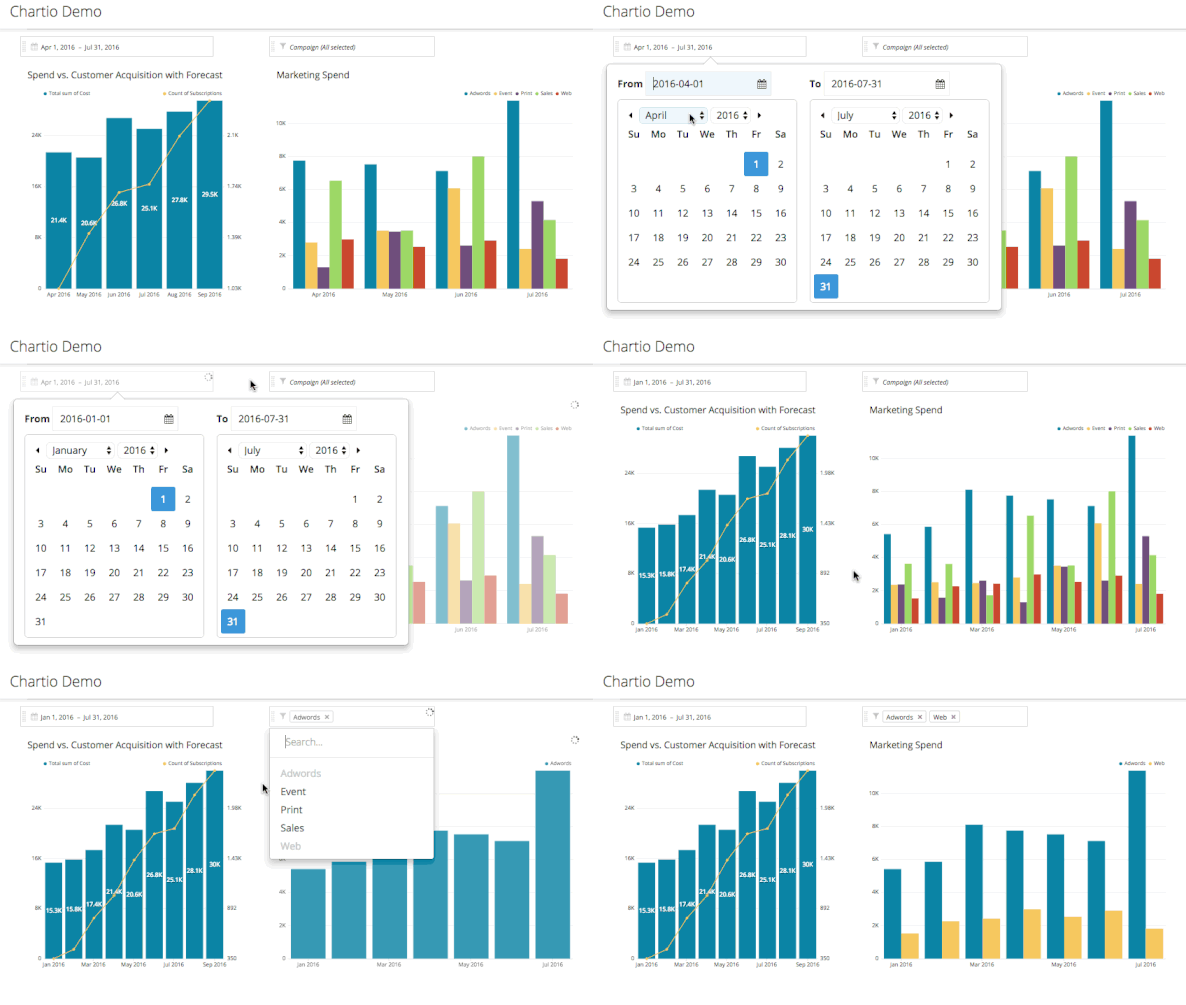
Through a lot of pestering and also some educated guesses, I used to build separate graphs for each view I thought I would need to present. Now, through the magic of Chartio’s Dashboard Variables, I can create charts with editable variables. These dashboard variables give the chart’s viewers control over aspects of the chart without having to open it up in editing mode.
What does that mean? It means I can set a chart to default to -say- the last 6 months, but give people looking at that chart the ability to change those dates. Or I can make a graph that looks at changes in something over time by week, but give viewers the ability to change it to look by day or by month.
It seems so simple, and there are certainly more complex ways to use Chartio’s Dashboard Variables, but for me the ability to make a chart that can have small adjustments made on the fly is so so helpful.

3) No more manually combining different data sources.
Most of the data I use is stored in Google Big Query, but Chartio integrates with a wide variety of data sources. Personally, I use Big Query, Google Analytics, and manually uploaded .csvs.
Before Chartio, when I wanted to combine data from multiple data sources I would pull it separately from each source and manually combine it in Google Sheets. Now I can build a single chart with dashboard variables that automatically updates, and when I build it, Chartio lets me easily blend the data from multiple sources directly in the chart.
4) No more having to trust someone else’s chart construction.
You know how anytime you see a chart you want to know exactly how the person who made it defined the variables and what the axis actually mean? No? Just me?
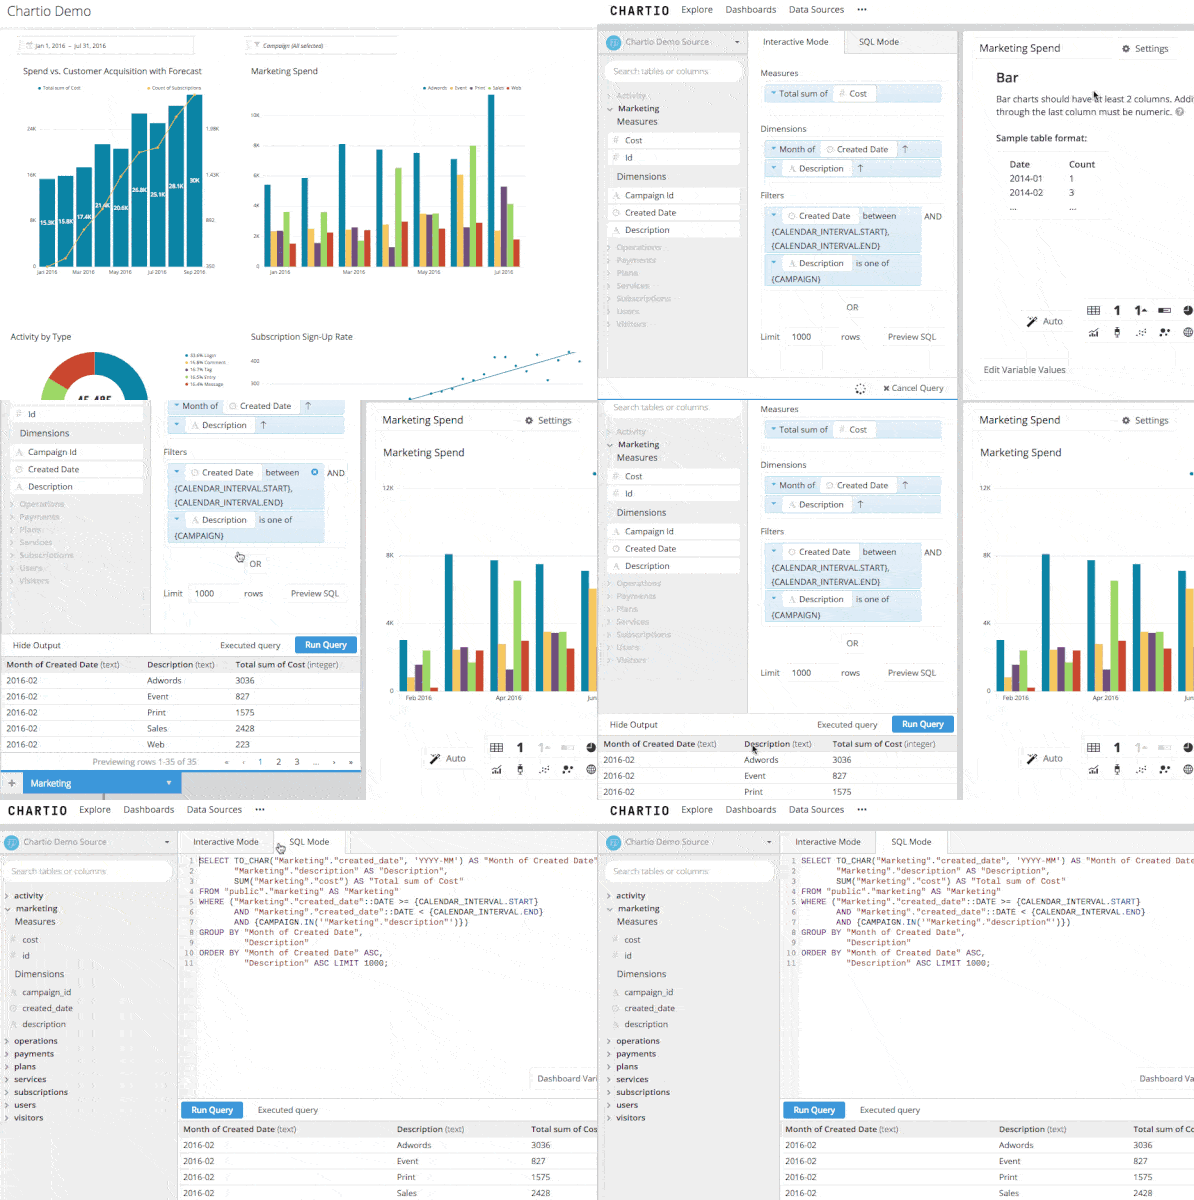
This one depends on what permissions your Chartio admin has granted (as one of our Chartio admins I can give myself permission for any chart) but essentially, if you see a chart on a dashboard and want to know how it was built, you can just peek inside and look.
Before we had Chartio we were using a service to visualize our Stripe billing data but we kept seeing inconsistencies between it and our internal data. Every time that happened I would have to guess what that service was or wasn’t considering until I figured out why things didn’t match.
Now if I come across a chart and I need to know what’s actually going into it, I just open it up and look. Sometimes it’s a chart one of my co-workers has built. Sometimes it’s a chart I built two months ago that has been quietly updating itself until I forgot exactly how I put it together. Sometimes it’s a chart that support has tweaked to solve a problem I was having. Anytime I need to, I just open a chart up to edit, peer at its insides and see how it’s assembled.

Of course, this one comes with a caveat, which is that you generally have to learn how to make charts in Chartio to understand what’s going on when you peek below the hood. For me, learning Chartio’s interactive mode has been 100% worth it, but in the early days when I was more familiar with SQL, I often switched to SQL mode in order to “read” the charts I was working on more easily. With time, and with copious help from Chartio documentation and support, reading Chartio is now kind-of my jam.
Which brings me to the last and most important thing I don’t have to do anymore because of Chartio.
5) No more going it alone.
Filestack is a small, tight-knit company and we all wear multiple hats, but it isn’t unusual for one or two people in the company to be the ones most familiar with a particular software we’re using. In the past, if I ran into a problem with data I was working on I might be the person most knowledgeable about the product I was using. Or someone knew more than me but that person already had a task list a mile long or was on vacation, so I would either have to wait for an answer or try my luck with Duck Duck Go (o.k. sometimes I resorted to Google too.)
One of the best best best things about using Chartio is their support. And I definitely use their support. Chartio still can’t answer all of my questions, questions that are specifically about our data are usually answered by our excellent Poland Dev Team, but anytime I run into trouble with using Chartio I can send an email off to support and expect to get a knowledgeable and helpful answer.
Chartio’s support team gets a very wide range of questions from me, from something as simple as “How do I get data from multiple tables in the same chart?” (Answer: Layers) to “How do I pivot this data store earlier so I can combine all these rows as columns?” (Answer: they rewrote some of my SQL for me) and they treat every question I have with the same patience and intelligence, regardless of how simple or difficult it is.
I’m not saying I’ve never had miscommunication with Chartio support (If this list were “5 things I’m learning while using Chartio” #1 would probably be “How to ask better questions”) but their team has consistently made the effort to meet me where I am, even hopping on a call with me when communicating via email wasn’t cutting it.
Basically everything cool I’ve done in Chartio required me to contact support at some point in building or maintaining it.
So, now that I’ve taken all your time to wax rhapsodic about one of my favorite software tools, what are the things that make your job better?
Filestack is a dynamic team dedicated to revolutionizing file uploads and management for web and mobile applications. Our user-friendly API seamlessly integrates with major cloud services, offering developers a reliable and efficient file handling experience.
Read More →